Here comes the YaST team again trying to flood your aggregator with blog post! Now it’s time for the story of how we reduced the critical path of the rebuild time of YaST RPM packages from 42min 2s to 29min 40s.
Chapter 1: where to optimize
Of course, the first step to start fixing something is finding out what exactly needs to be fixed. In our case, this breaks down into
- knowing the dependencies, and
- knowing the individual build times.
Dependencies
It is tempting to figure out the dependencies by yourself, by parsing
the spec files. But it is hard to do right, and, more importantly, a
reinvention of the wheel. The Build Service must know all this to be
able to schedule the builds, and provides a convenient way to access it,
with osc dependson:
$ osc dependson YaST:Head openSUSE_Factory x86_64
[...]
yast2-x11 :
   yast2-devtools
yast2-xml :
   yast2-core
   yast2-devtools
yast2-ycp-ui-bindings :
   libyui
   yast2-core
   yast2-devtools
Individual build times
For each source package, the Build Service produces not only binary RPMs
but also a _statistics file, available in the web UI or via osc
getbinaries. We were interested in the total build time, although the
data was of limited use because packages can be built on machines with
vastly different power and this information is not included.
Chapter 2: how to optimize
Once we knew which screws needed to be tightened, it was time to do it. Fortunately we had more than one tool for the job.
Stop using Autotools
Autotools (automake, autoconf and configure) took up a majority of the time needed for building YaST packages. Now that most of those packages are written in pure Ruby, we don’t need autotools there checking for portability problems that we don’t have. Autotools are a leftover from the times 15 years back when they were the only sensible option. We have wiped them out where possible and have been switching to our own set of Rake tasks.
Stub the APIs used in tests
We run a mixture of unit and integration tests at RPM build time. The downside of this is that we pull in many of the run time dependencies. Fortunately Ruby is a dynamic language and makes it easy to replace interfaces by stubs. That enables us to cut those dependencies.
In fact, we also have some Perl code, notably in yast2-users. Although the stubbing techniques across languages are messier than with pure ruby, they are still effective for our purposes.
Do not build specialized documentation
This one is simple: if the development documentation is only useful for people that will check out the git repo anyway, then leave it out from the RPM.
Appendix: the details
Enough of high-level explanations, we we promised you graphs, code and all kind of gory details, and a promise made is a debt unpaid. So there we go.
Dependency graphs
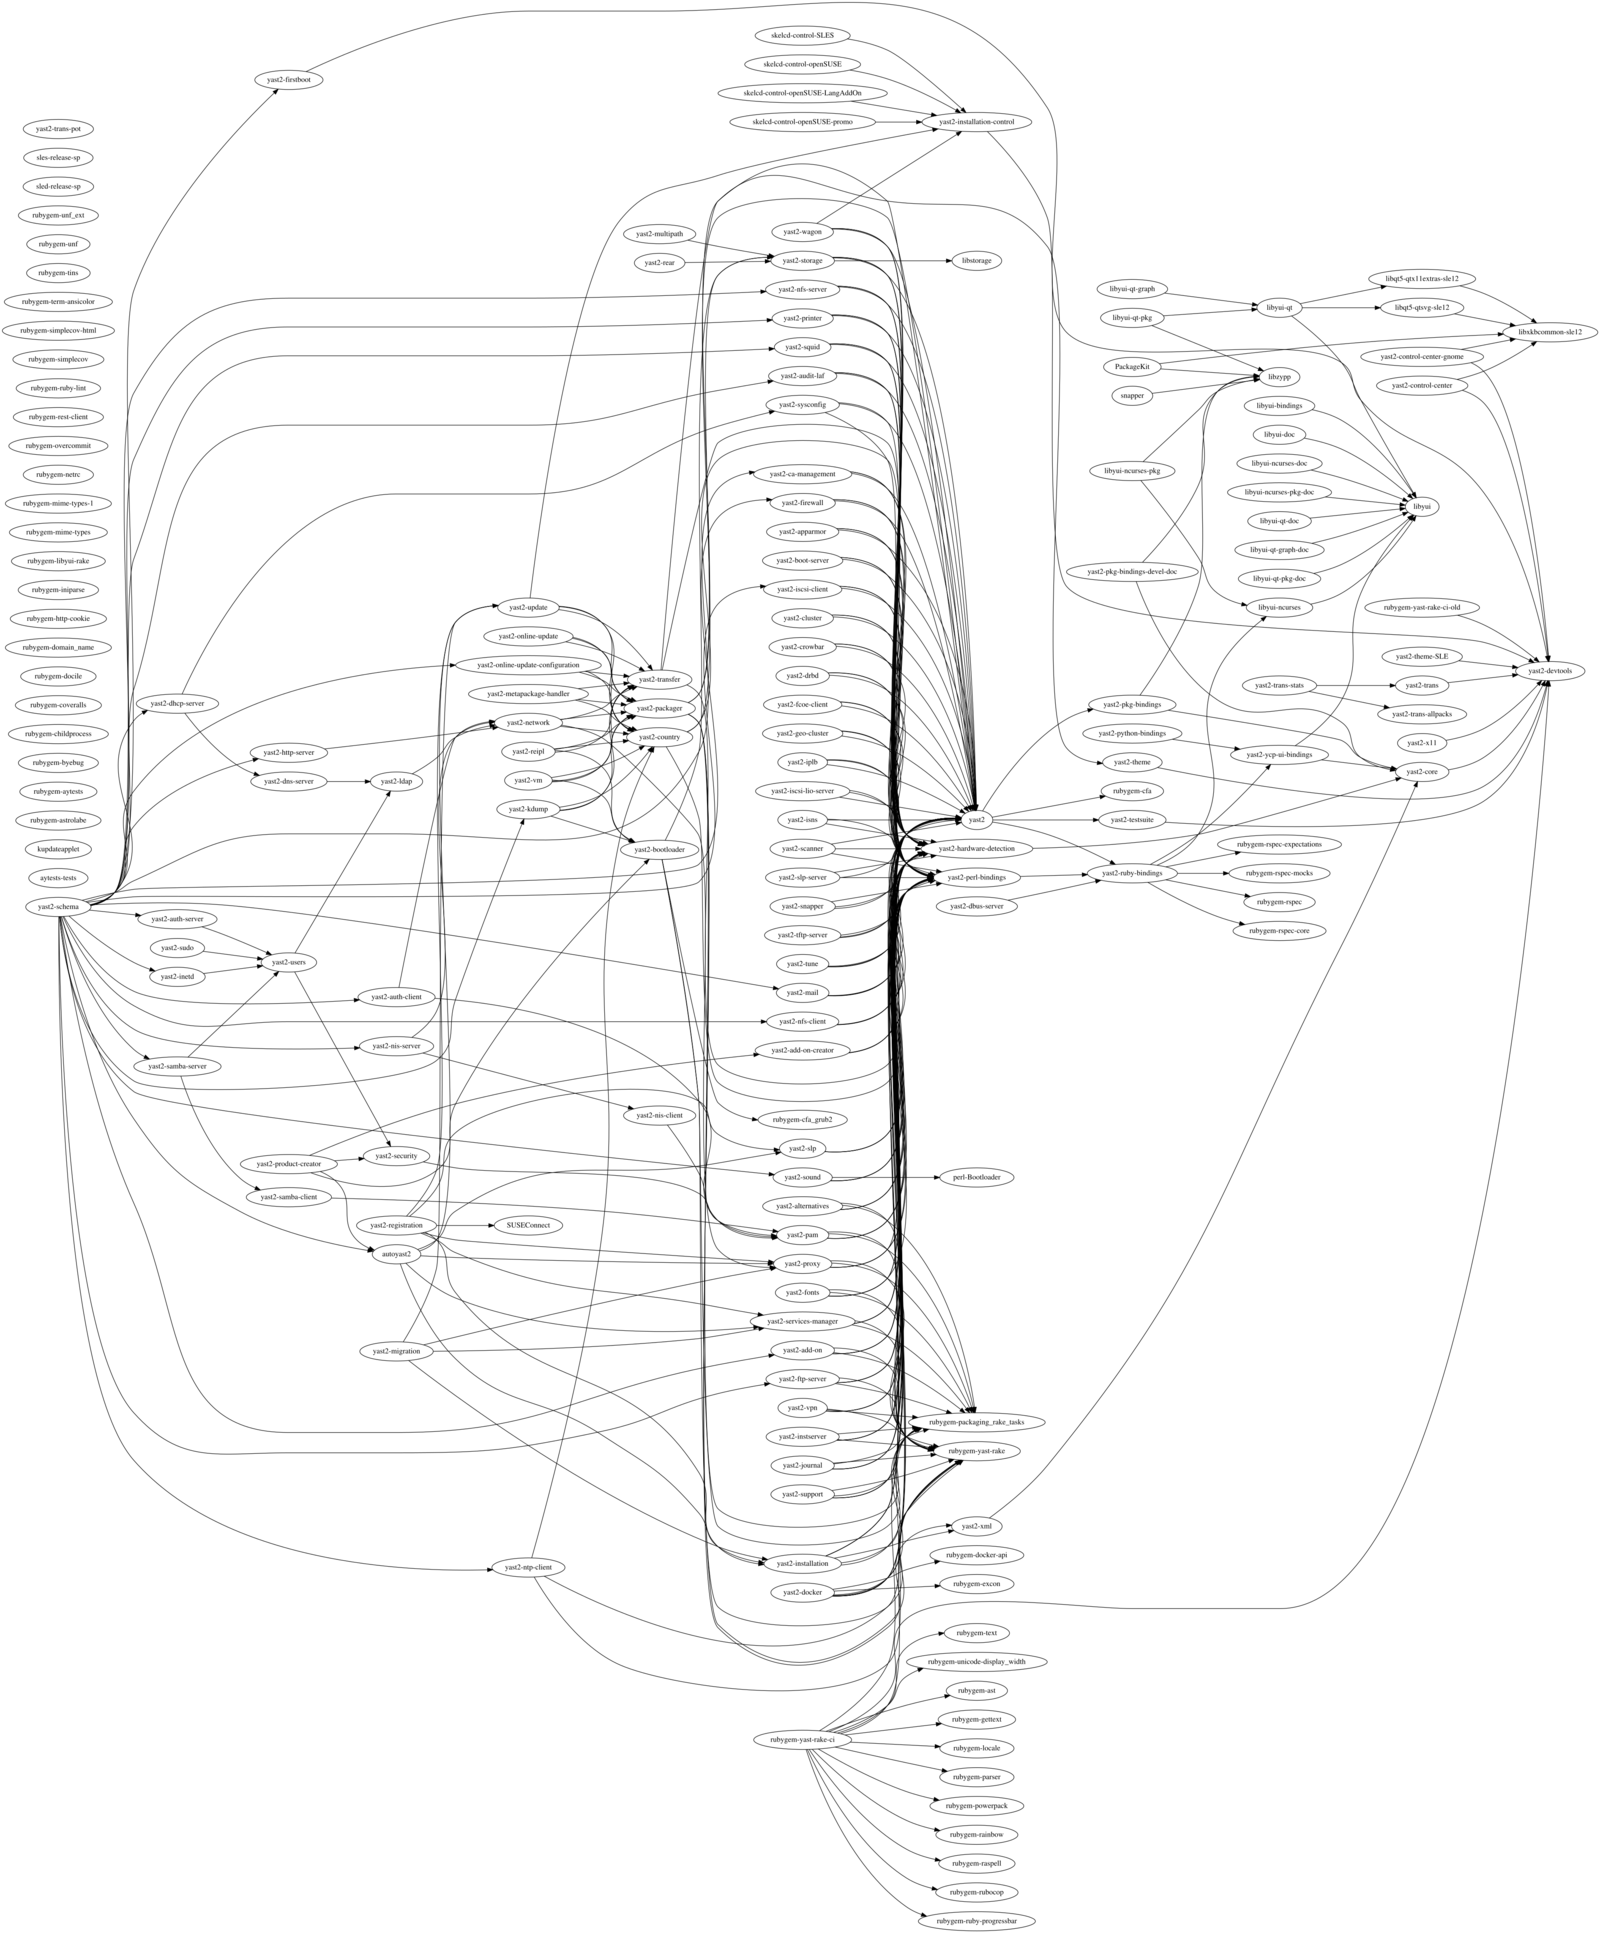
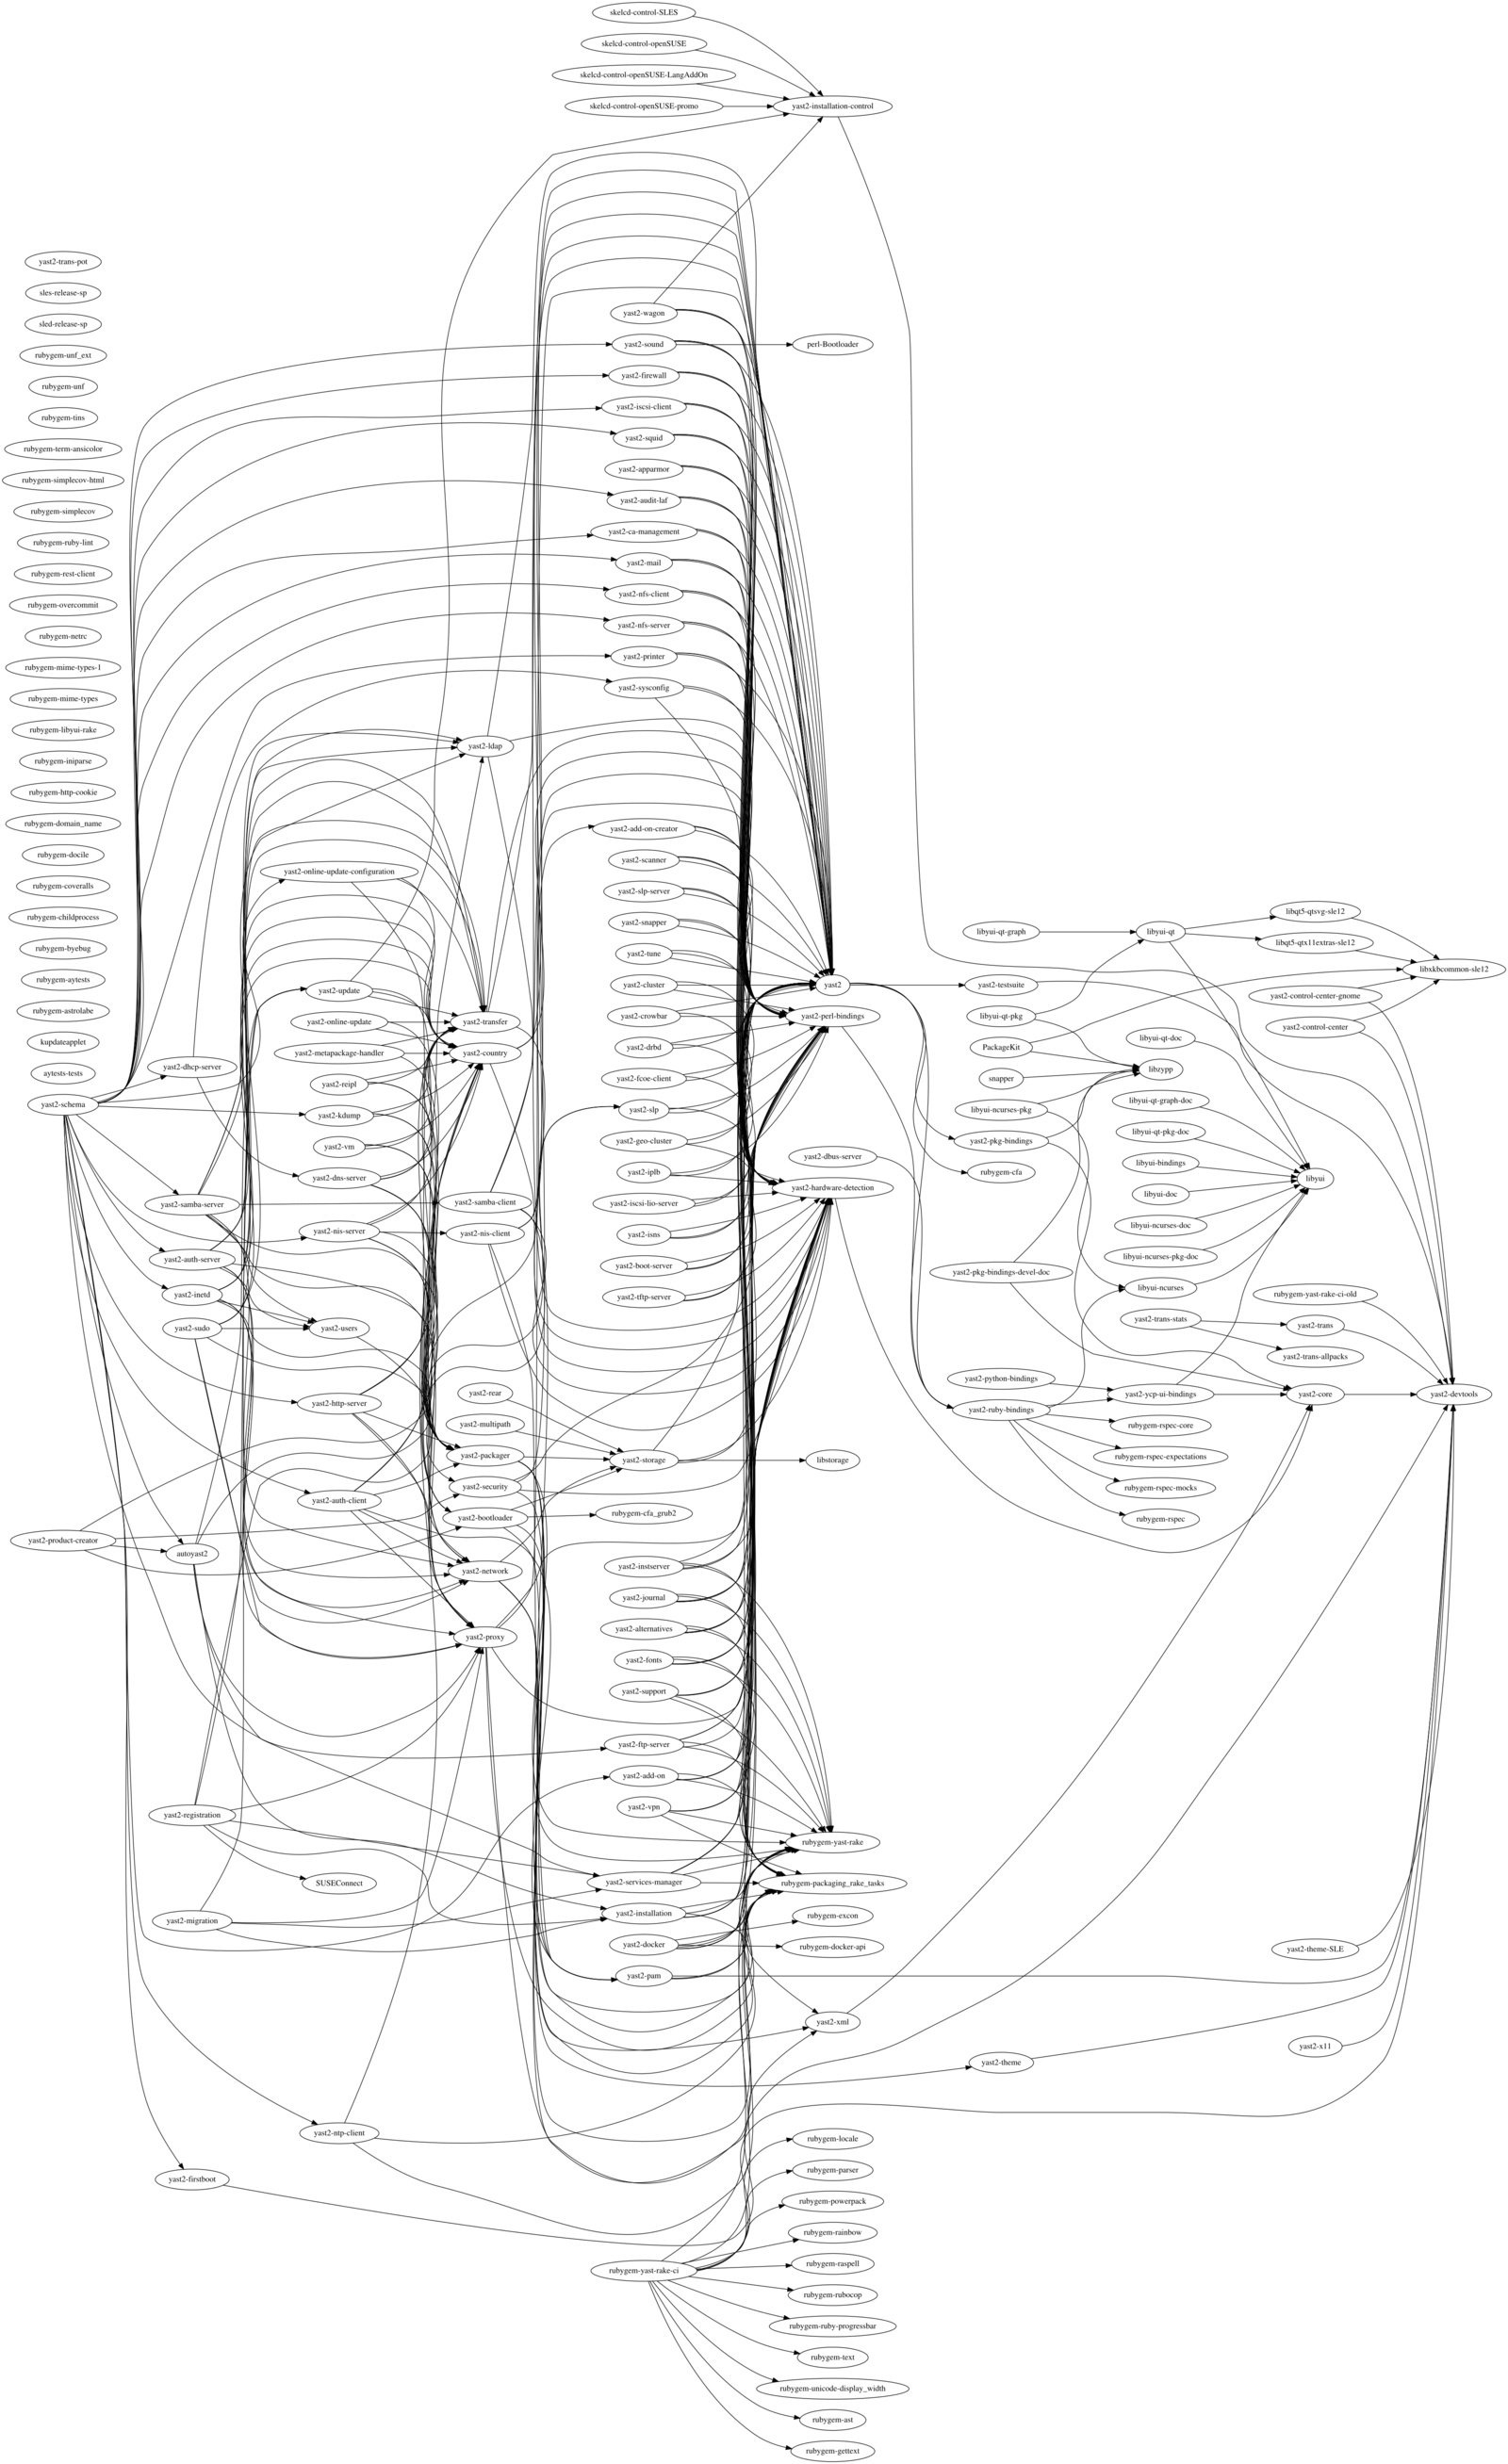
A picture is worth a thousand words. That’s why we came up with this small tool to generate a graphical representation of the dependencies of the YaST packages. In the resulting graphs displayed below, a node is a source package in the build service, and an arrow means “needs for its build”. Redundant arrows are omitted (that is, we’ve erased an A→C if both A→B and B→C existed).
We can see that the most prominent conclusion is that there is a large number of packages that depend on yast2, a collection of basic libraries.
But on top of that, in the original graph there are 6 more layers, and the graph is not very dense there. After our fixes, there are only 4 layers that are more dense.
Is worth mentioning that the “layer” concept only works if the packages take roughly the same time to build; it would not be helpful if there were huge variations. To get a more accurate picture, we should have generated a histogram of build times. But the graph was good enough in our scenario… and we had to stop the analysis at some point. :simple_smile:
The build dependency graph before our fixes:
The build dependency graph after our fixes:
Build statistics
If those graph are not geeky enough for you, here you are the detailed build statistics from the build service
<buildstatistics>
  <disk>
    <usage>
      <size unit="M">1118</size>
      <io_requests>15578</io_requests>
      <io_sectors>2156642</io_sectors>
    </usage>
  </disk>
  <memory>
    <usage>      <size unit="M">580</size> </usage>
  </memory>
  <times>
    <total>      <time unit="s">756</time> </total>         <!-- THIS -->
    <preinstall> <time unit="s">8</time>   </preinstall>
    <install>    <time unit="s">72</time>  </install>
    <main>       <time unit="s">555</time> </main>
    <download>   <time unit="s">4</time>   </download>
  </times>
  <download>
    <size unit="k">33564</size>
    <binaries>53</binaries>
    <cachehits>24</cachehits>
    <preinstallimage>preinstallimage.preinstallimage.tar.gz</preinstallimage>
  </download>
</buildstatistics>
Epilogue
This was definitely an interesting journey. We learned quite some things. Specially we learned that there is still room for improvement, but most likely the time reduction will not pay off for the time invested implementing those improvements.
We have to be realistic and keep working in other interesting stuff to fuel the next sprint report, coming next week!